What to Watch in the Week Ahead:
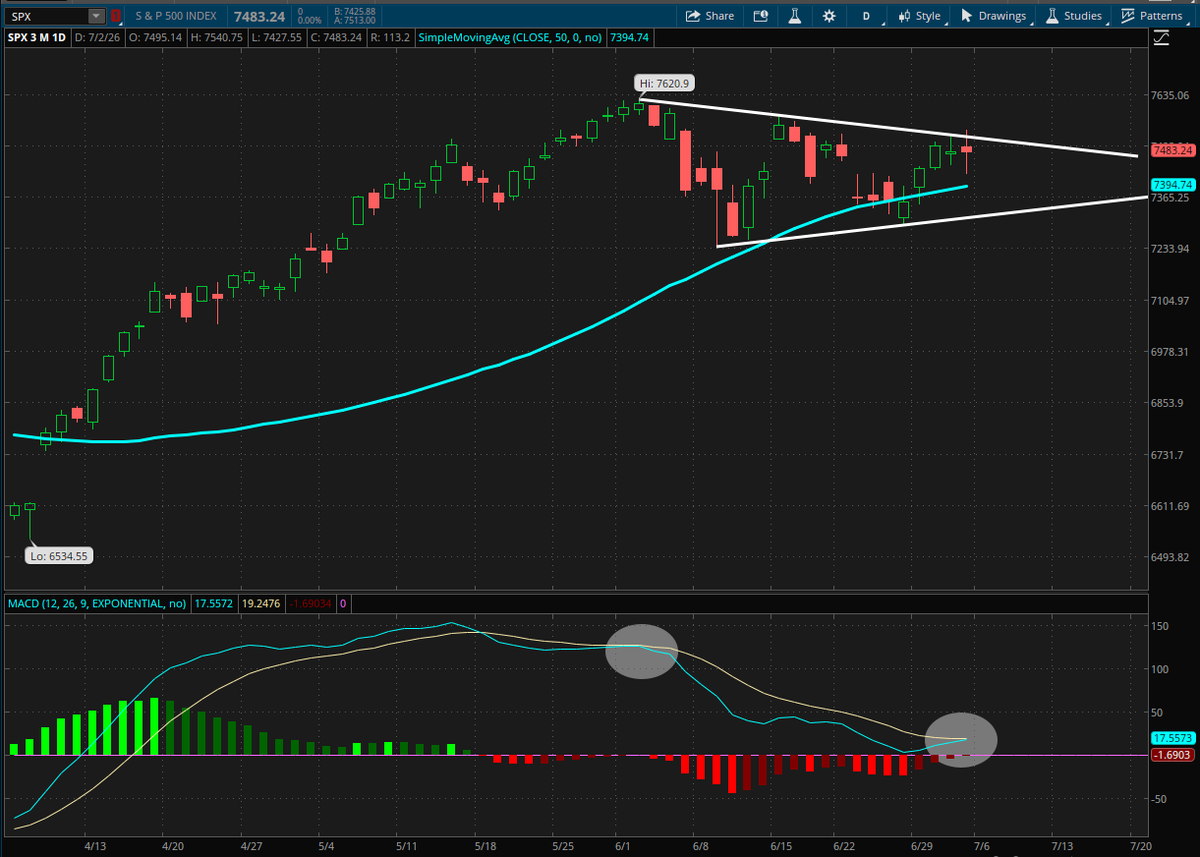
$SPX – The S&P found resistance of its triangle consolidation last week. Intermediate support sits at the 50 DMA ~7400. Downside momentum seems to be waning with a possible bullish crossover, but this signal failed back in early June. We may see a retest of this lower support line this week. Keep in mind that the measured move from this consolidation is roughly 400 points, meaning if SPX breaks outside of these trendlines, you could see the market trend in a sizeable direction.
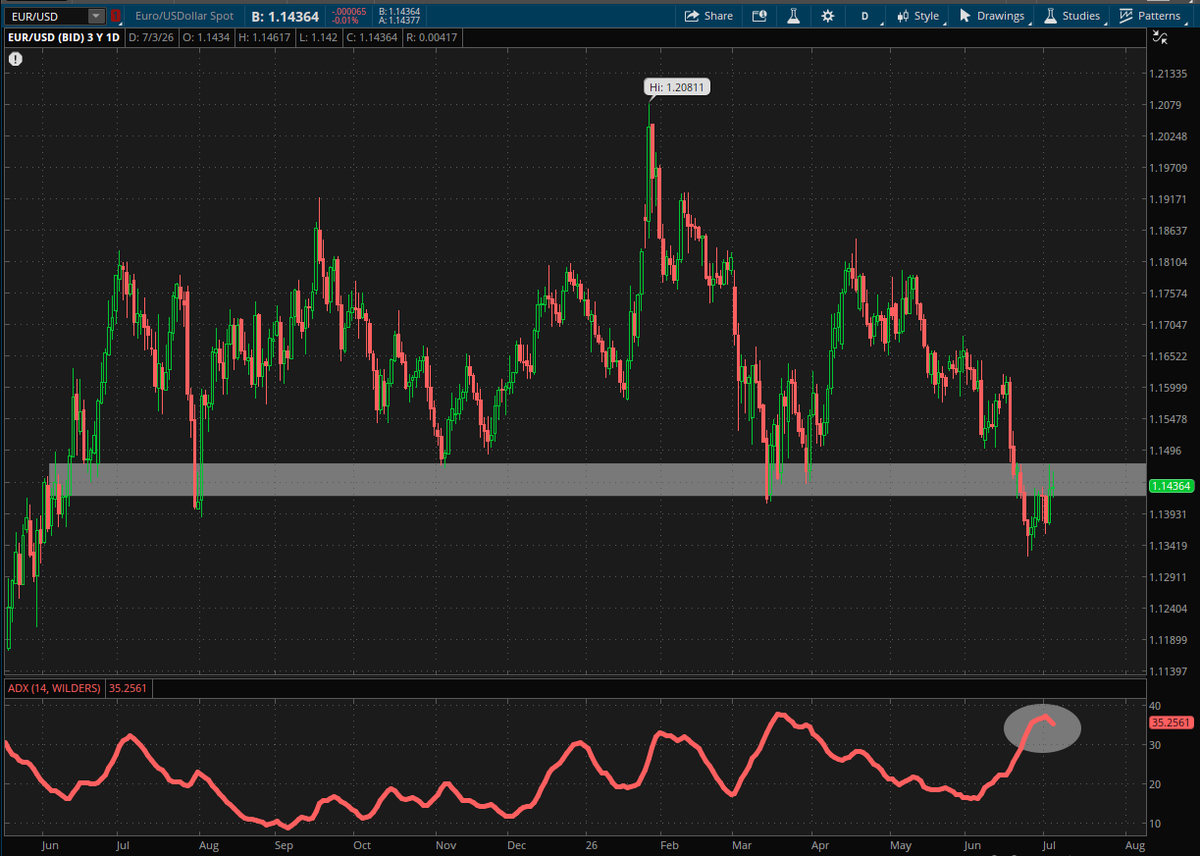
$EUR/
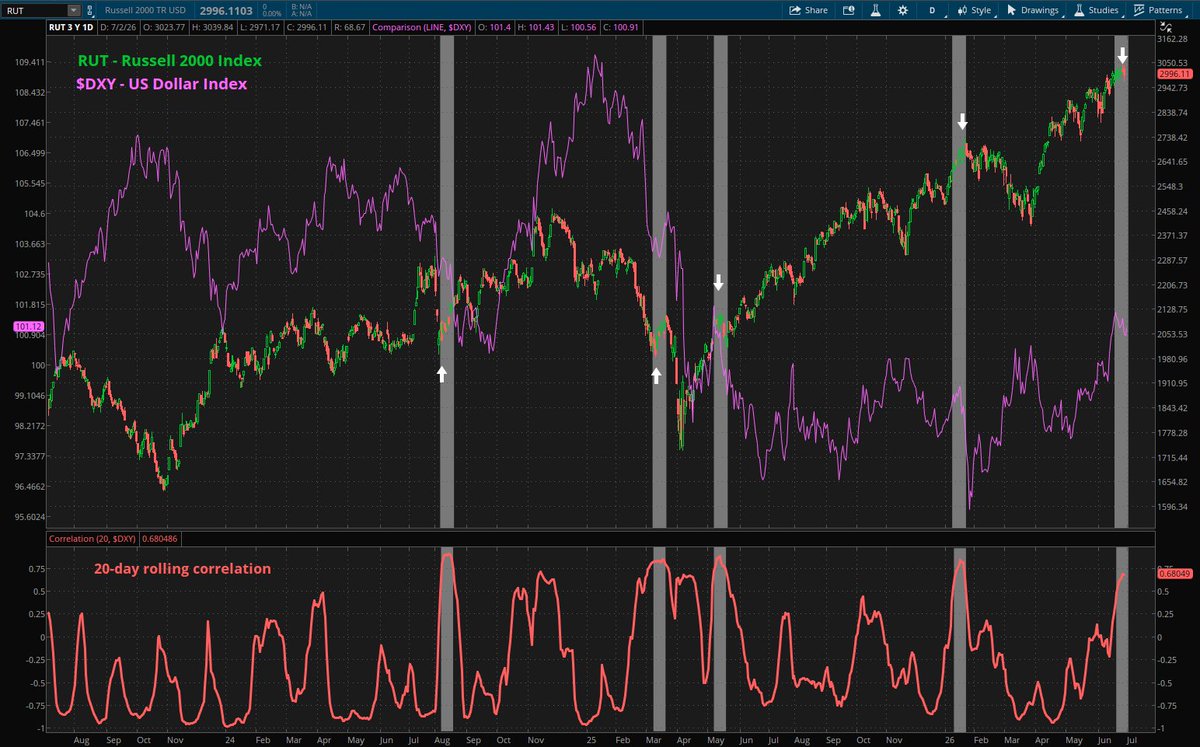
$USD – This pair broke multi-year support nearly 2 weeks ago, but has pulled back to new resistance. This is looking like it could be the early stages of a false breakdown, meaning that the upward breakout in the Dollar Index ($DXY) could also reverse back under 100, propelling risk appetite. Note the Average Directional Index (ADX) beneath creating a peak – this signals traders to close trend positions, meaning that the downtrend in EUR/USD could reverse here.
$RUT – Small caps are forming a rising wedge (these typically break downward) with a bearish momentum (MACD) divergence and crossover. The ADX is reaching the lowest levels all year. ADX troughs signal the market is about to accelerate in a trend direction. Keep in mind the uptrend has not yet broken, despite some yellow warning signs.
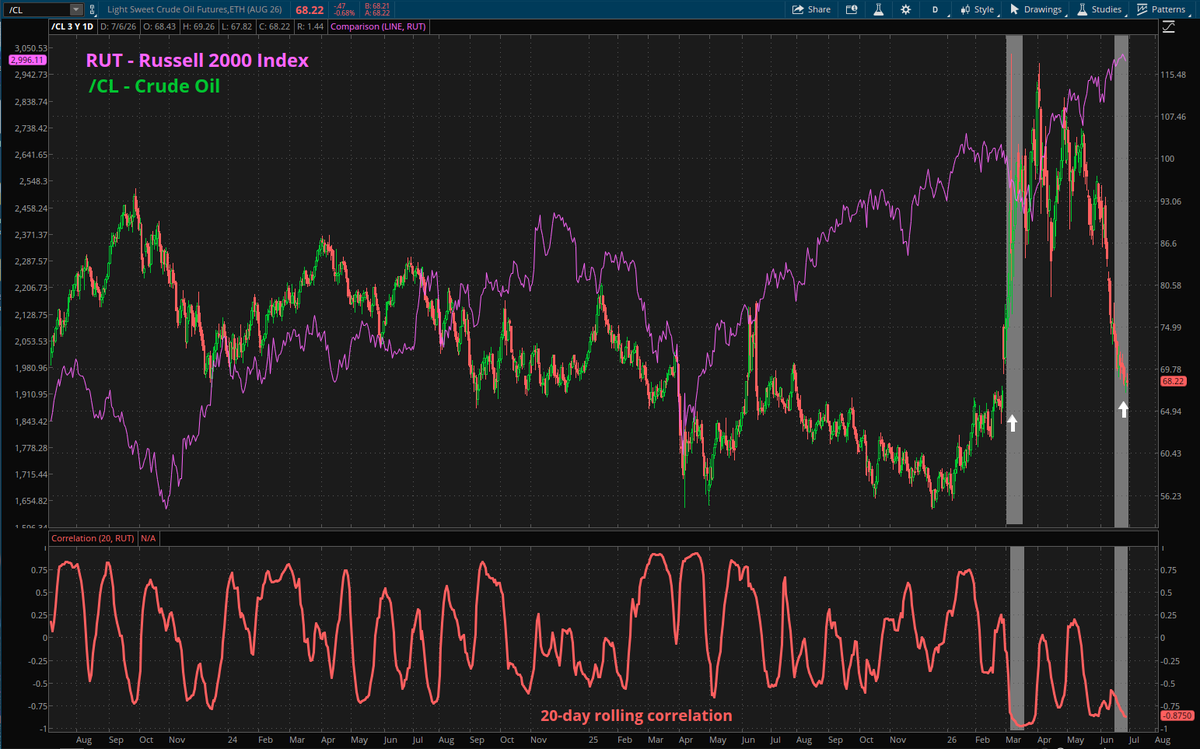
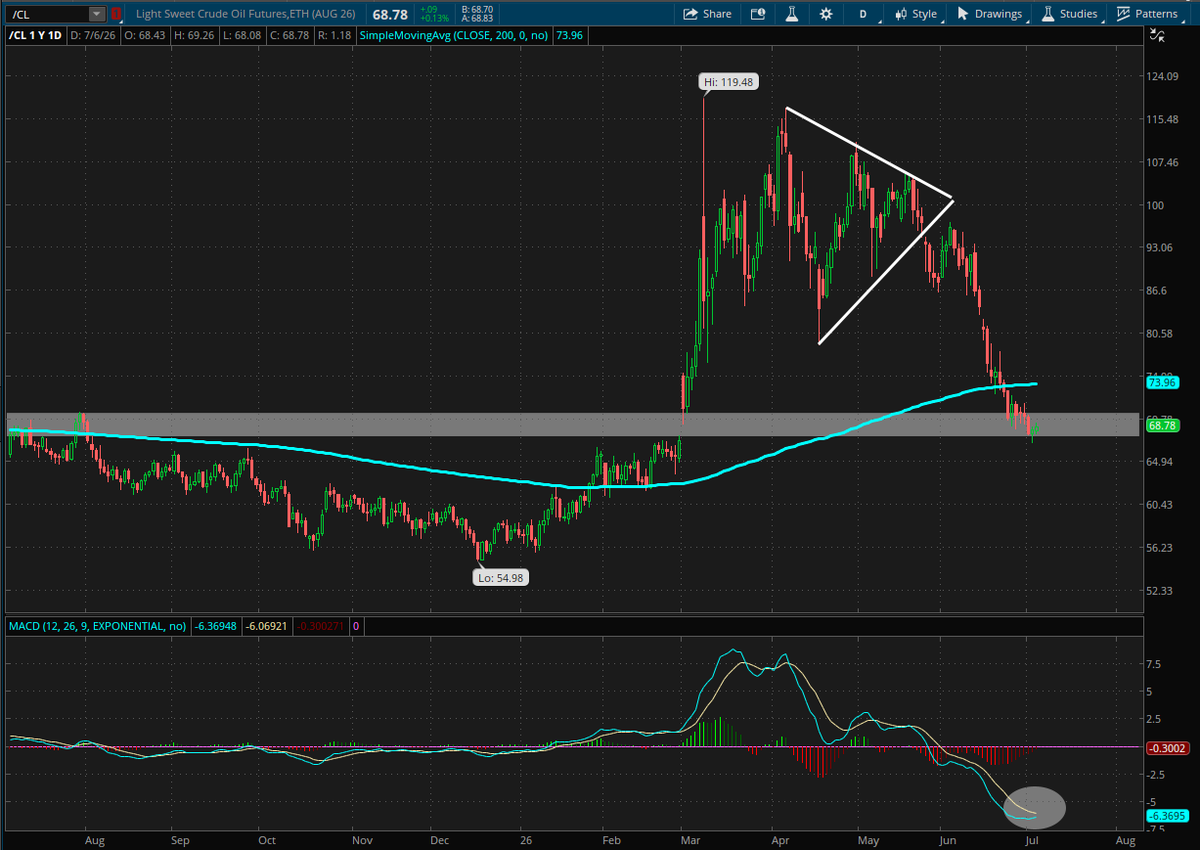
$CrudeOil – Crude is sitting at long term support and price volatility has slowed down. Momentum is extended to the downside, and it looks as though the MACD is looking to print a bullish crossover here this week. Keep an eye out for the 200 DMA at $74 as near-term resistance that could be tested this or next week.
*Not a recommendation
@SchwabNetwork @SchwabTrading