Global Markets Investor is a financial research platform covering global markets and economies. Founded by a Wall Street equity and macro research professional.

Joined July 2023
10,044 Photos and videos
⚠️Portfolio performance for JUNE 2026 GMI's portfolio has gained 12.26% YEAR-TO-DATE, compared to the S&P 500 at 9.55%, the Nasdaq 100 at 19.91% Since January 2024, GMI’s portfolio has returned 93.43%, beating the S&P 500 by 36.21 ppts.👇 globalmarketsinvestor.beehii…
2
2
14
5,995
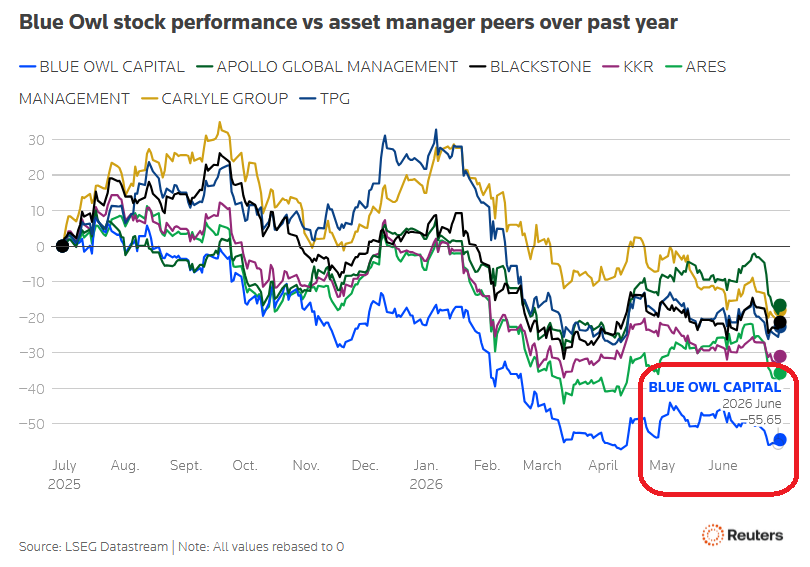
🚨US private credit stocks are plummeting: Blue Owl Capital shares are down -55.6% over the past 12 months. This dramatically underperforms Apollo, Blackstone, KKR, Ares, Carlyle, and TPG, all of which are down roughly -17% to -38% over the same period. This comes as redemption requests at Blue Owl's 2 largest funds totaled $4.7 billion in Q2, still far above the funds' 5% quarterly withdrawal cap. Its technology-focused fund, OTIC, saw the greatest pressure, with 38.1% of shares tendered for redemption, more than double the 9% to 17% range seen at the largest peer funds that have reported Q2 results. Its flagship fund, OCIC, saw redemption requests reach 18.8% of shares, alongside $660 million in net outflows. Across the broader private credit industry, investors requested a record $15.6 billion in redemptions in Q2, with only 38% of requests met, leaving $9.7 billion unmet, the highest amount on record. The $2 trillion private credit industry crisis is getting worse.
4
5
25
2,967
⚠️Bubble Indicator is flashing RED for US semiconductors and tech: BofA's proprietary Bubble Risk Indicator rose to 0.91 for the US Semiconductor Sector, the highest since the indicator's inception in 2023. TAP IMAGE TO SEE FULL INSIGHT👇 globalmarketsinvestor.beehii…
1
4
1,023
⚠️Hedge funds are DUMPING Magnificent 7 stocks at a rapid pace: Mag 7 gross exposure as a percentage of total hedge fund US exposure has fallen from ~11.5% in late 2025 to 8%, the lowest in over 12 months. This is the 2nd-lowest level in at least 3 years. Net exposure has dropped even more sharply, from a peak of ~21.5% to ~14.5% over the same period, also approaching the lowest level since at least 2023. This comes as the Magnificent 7 has underperformed the broader market in recent weeks, forcing hedge funds to cut long exposure while increasingly betting against the group. The Magnificent Seven ETF, $MAGS, is down -8% since mid-May. The group has gone nowhere now for ~9 months. Has the Magnificent 7 euphoria finished?
12
14
51
5,160
‼️The Japanese yen just hit a level not seen in 40 years: USD/JPY rose to 162.5, the weakest level for the yen since 1986, levels last seen before the Plaza Accord triggered a multi-year appreciation of the currency. TAP IMAGE TO SEE FULL INSIGHT👇 globalmarketsinvestor.beehii…
1
6
1,216
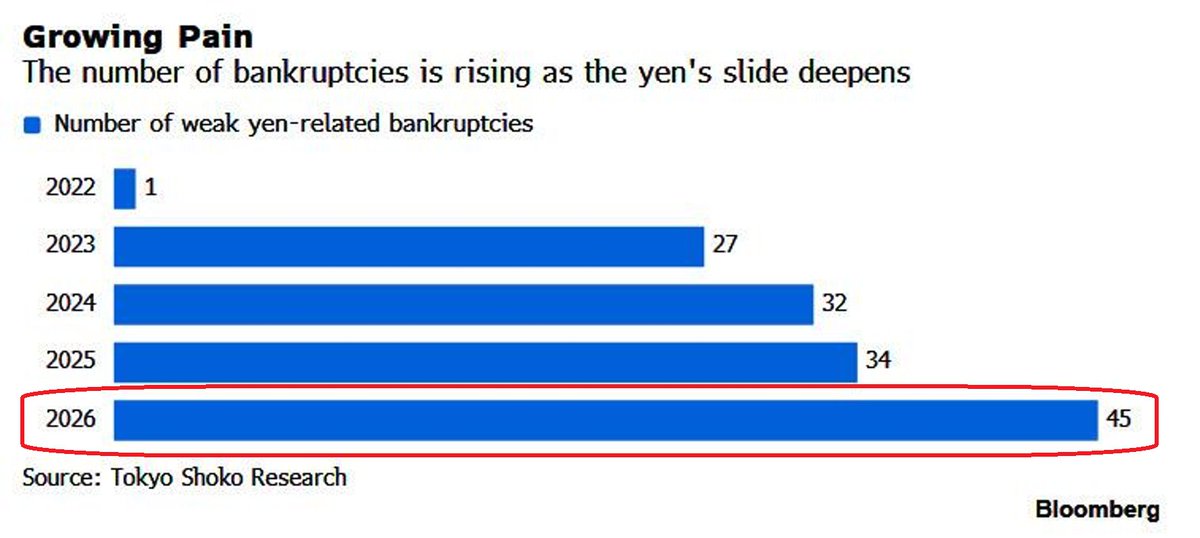
‼️Japan's weak yen is driving a record wave of bankruptcies: 45 Japanese firms went bankrupt in the first half of 2026, citing the weak yen, the highest H1 total since at least 2022. This is up 32.4% from 34 in the first half of 2025, and up from 27 in 2023. This comes as the yen again traded past 162 per dollar this week, around its weakest level since 1986. Bankruptcies are concentrated in the wholesale sector, where import-dependent firms have little power to pass rising costs onto customers. Adding to the pressure, many smaller importers hedge with reverse knockout options, contracts that expire once the yen crosses a preset trigger level, forcing firms to buy dollars at the worst possible moment. Meanwhile, the yen is set to weaken further, to as much as 170 per dollar, which could trigger a fresh wave of failures. The Japanese economy is increasingly struggling due to FX weakness.
11
20
63
6,666
🔴THIS STAT IS ABSOLUTELY MIND-BLOWING: South Korea's total market cap to GDP ratio, or the Buffett Indicator, is up to 291.1%, near a record high. This is more than 3 times the 20-year average of 93.9%. TAP IMAGE TO SEE FULL INSIGHT👇 globalmarketsinvestor.beehii…
2
9
1,820
⚠️Hedge funds are DUMPING Asian stocks: Hedge funds sold Asian equities at the 2nd-fastest pace in June in at least 5 years, only below March. Japan led the outflows, posting the largest monthly outflow on record. South Korea followed, reversing all of its year-to-date inflows, with net flows falling from a peak of 5% of Asia's net market value in early June to roughly flat. Is the semiconductor trade in South Korea coming to an end?
15
45
151
16,036
🔴Foreign investors are amplifying the pressure on Japan's bond market: Overseas investors dumped -$19.2 billion of Japanese government bonds so far in June, the largest monthly outflow since Jan 2023. TAP IMAGE TO SEE FULL INSIGHT👇 globalmarketsinvestor.beehii…
7
6
21
5,318
‼️DEAR LORD: Taiwan's stock market capitalization is up to a record 485% of GDP, nearly TRIPLING since 2022. South Korea's stock market capitalization is up to a record 242% of GDP, more than TRIPLING since 2022. TAP IMAGE TO SEE FULL INSIGHT👇 globalmarketsinvestor.beehii…
5
14
60
6,442
‼️The US money supply is growing at its fastest pace in years: M2 money supply jumped $247.8 billion in May, the largest monthly increase since May 2021, exceeding $23.1 trillion for the first time. TAP IMAGE TO SEE FULL INSIGHT👇 globalmarketsinvestor.beehii…
7
11
27
7,880
Global Markets Investor reposted
🔴US semiconductor stocks' volatility is EXPLODING: The average 3-month implied volatility of the 10 largest semiconductor stocks by weight has surged to ~72% in June 2026, the highest in at least a DECADE. This is more than DOUBLE the ~32% level seen in June 2016. Meanwhile, the semiconductor ETF, $SOXX, is down -14% over the last several trading sessions. At the same time, the 3x leveraged long semiconductor ETF, $SOXL, is down -40%. Implied volatility reflects how much price swing options markets are pricing in. A near-doubling means investors now expect much larger moves in both directions from the sector that has led the entire AI rally, meaning it could drag down the entire market if something goes wrong. This level of volatility is also resembling the run-up to the 2000 dot-com peak, when semiconductor stocks also saw extreme repricing before the cycle turned. Is the last leg up in semiconductors behind us?
16
29
99
11,465
Global Markets Investor reposted
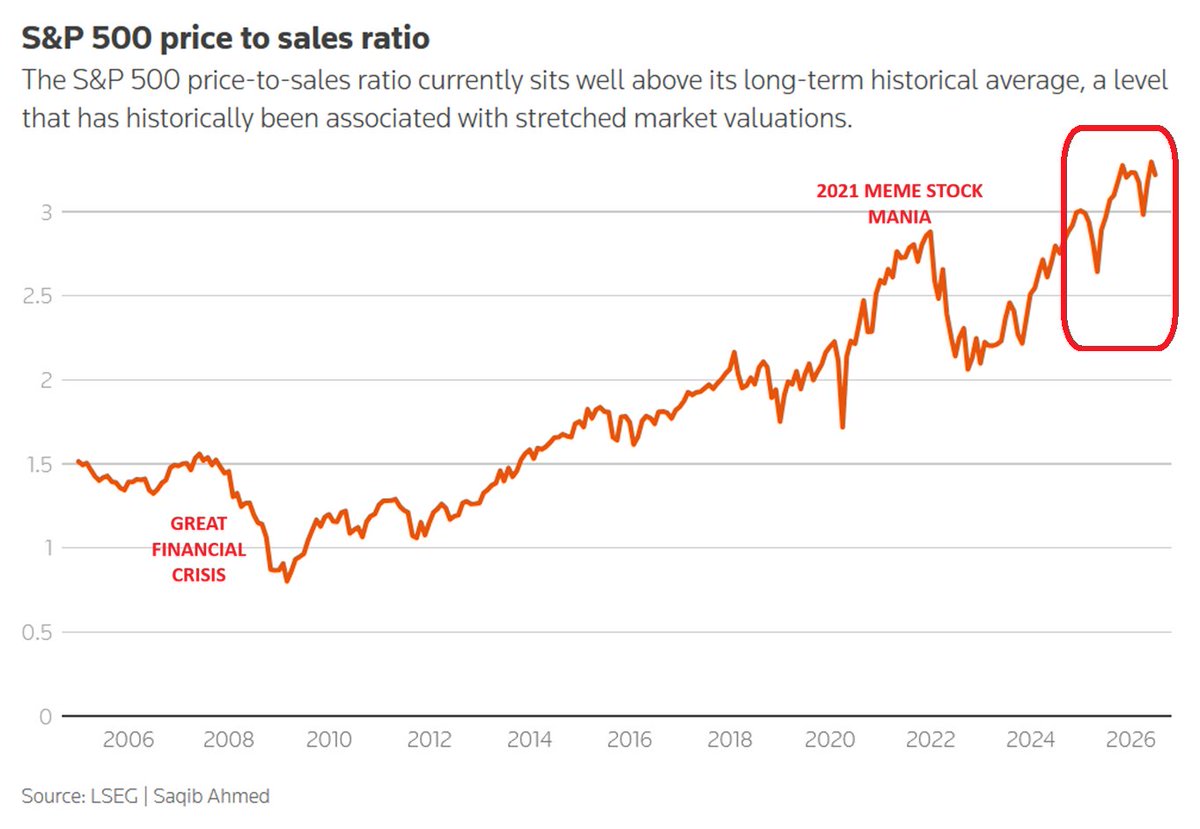
‼️The US stock market is EXTREMELY overvalued: The S&P 500 price-to-sales ratio rose to a record 3.2x. This is well above its long-term average of 1.8x, and above the 2.3x peak reached during the 2000 Dot-Com bubble. By comparison, the S&P 500 price-to-earnings ratio sits at 20.2 times expected 12-month earnings, below the 25.2 level reached at the height of the Dot-Com bubble. This makes it one of the few valuation metrics not currently at or near record highs. However, this ratio may be distorted, as earnings supporting this ratio are heavily influenced by AI infrastructure spending that may not generate sustainable returns. Put simply, companies supplying AI infrastructure are benefiting, while the firms funding the buildout still need to prove the payoff. If those earnings turn out to be unsustainable, the market may already be more overvalued than this ratio suggests. Market optimism is running way ahead of earnings reality.
22
42
143
11,667
Global Markets Investor reposted
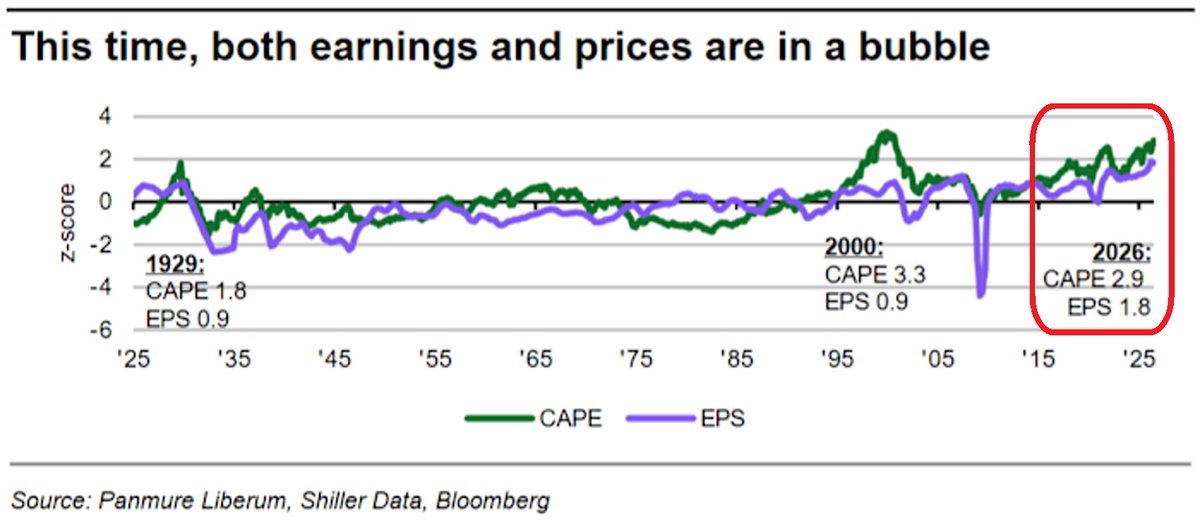
⚠️Is this a valuation bubble, an earnings bubble, or both? The S&P 500's cyclically adjusted price to earnings ratio (CAPE) rose to 41x, the highest since the 2000 Dot-Com Bubble peak. This is also 2.9 standard deviations above the trend, similar to the 3.3 standard deviations seen at the 2000 Dot-Com top. Unlike previous bubbles, though, earnings themselves are also elevated and surged to 1.8 standard deviations above the historical trend. By comparison, earnings during both the 1929 and 2000 bubbles stayed within a normal range, under 1 standard deviation above trend. If today's CAPE ratio is adjusted to strip out this earnings bubble, the ratio would jump to 67.6x, or 4.6 standard deviations above trend, and 53% above the 44.2x peak in 2000. If earnings normalize, valuations could see a correction far steeper than investors expect.
7
18
58
8,959
Global Markets Investor reposted
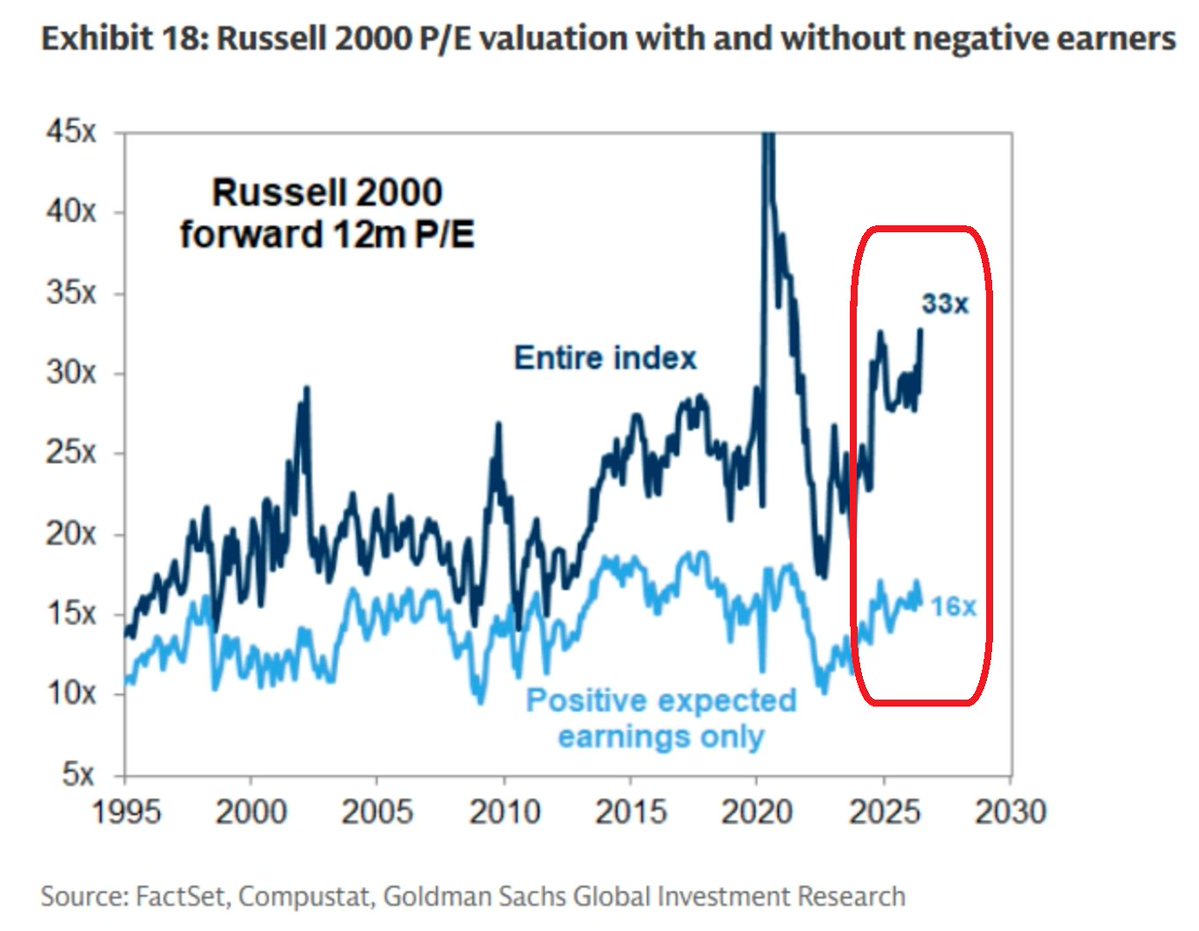
🚨US small-cap stocks are HISTORICALLY EXPENSIVE: The Russell 2000 forward P/E ratio rose to ~33x, way above the peak reached during the 2000 Dot-Com Bubble. Even after excluding companies with negative expected earnings, the index still trades at ~16x forward earnings, near the highest level in ~30 years. This comes as nearly ~40% of Russell 2000 companies remain unprofitable, driving a large gap between the index's headline valuation and that of its profitable companies. Put simply, small-cap valuations are pricing in a near-perfect earnings outlook. Any disappointment could leave little room for error.
9
22
125
13,103
Global Markets Investor reposted
🔴THIS STAT IS ABSOLUTELY MIND-BLOWING: South Korea's total market cap to GDP ratio, or the Buffett Indicator, is up to 291.1%, near a record high. This is more than 3 times the 20-year average of 93.9%. A modified version of this ratio, which also factors in the total assets of Korea's central bank, stands at 239.4%, also more than 3 times its own 20-year average of 73.9%. Both readings place Korea in Significantly Overvalued territory, the most extreme of 5 valuation zones tracked by the model. If these ratios revert to their historical averages over the next 8 years, it implies Korea's stock market could return -8.6% a year, while the modified model implies -9.1%. Is Korea's historic rally about to run into an equally epic mean reversion?
7
27
130
15,532
Global Markets Investor reposted
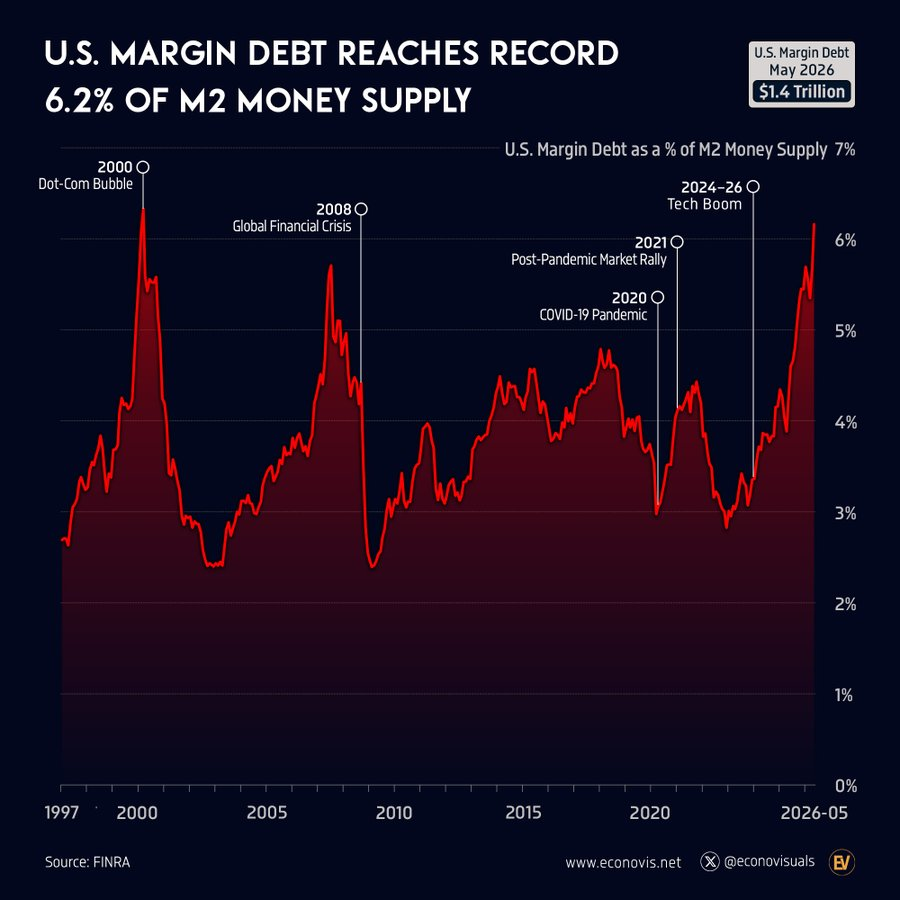
🚨US MARGIN DEBT IS FLASHING A WARNING: US margin debt as a share of M2 money supply spiked to 6.2% in May. This is just shy of the all-time record of 6.3%, set at the height of the 2000 Dot-Com bubble peak. Total margin debt now stands at $1.4 trillion, an all-time high in dollar terms. Historically, spikes in margin debt relative to money supply have preceded major market tops. Margin debt peaked in March 2000, just months before the Dot-Com collapse, and again in July 2007, 3 months before the S&P 500 topped out ahead of the Financial Crisis. Most recently, it peaked in October 2021, 2 months before the S&P 500's December 2021 high, preceding a -25% drawdown through September 2022. Will history repeat itself?
47
223
774
102,001
Global Markets Investor reposted
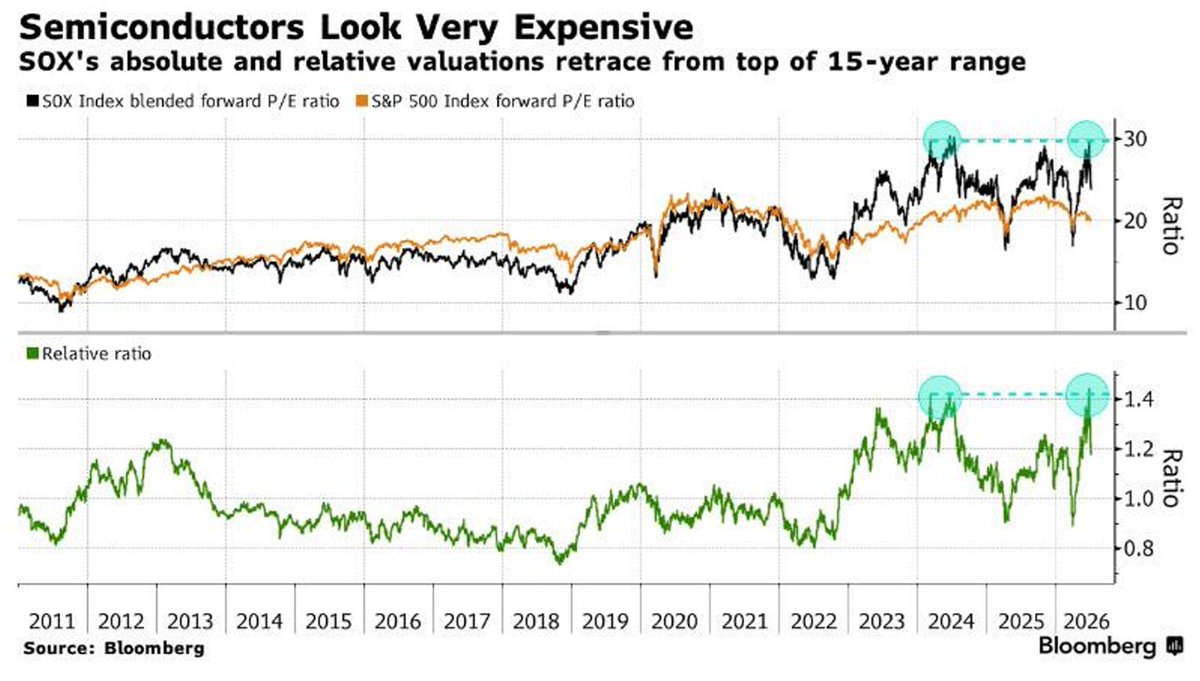
⚠️US semiconductor stocks are INCREDIBLY EXPENSIVE: The semiconductor index $SOX forward P/E ratio hit ~30, near the top of its 15-year range. Relative to the S&P 500, semiconductors traded as high as ~1.4 times the index's own valuation, also near a multi-year high. This comes as doubts are rising over whether AI capital spending is delivering a sufficient return. One closely watched measure of what companies actually pay for AI tokens is down almost 20% from its May peak, after nearly doubling since December. This may reflect fading pricing power that could weaken the investment case for continued spending. Meanwhile, Allianz Research estimates the gap between AI investment and AI-related revenue growth at ~46%, wider than the 32% gap during the 2001 telecom bust. Semiconductor valuations are now increasingly tied to whether AI spending can keep justifying itself. Are these early signs of a correction in semis pricing power?
16
40
149
14,997
Global Markets Investor reposted
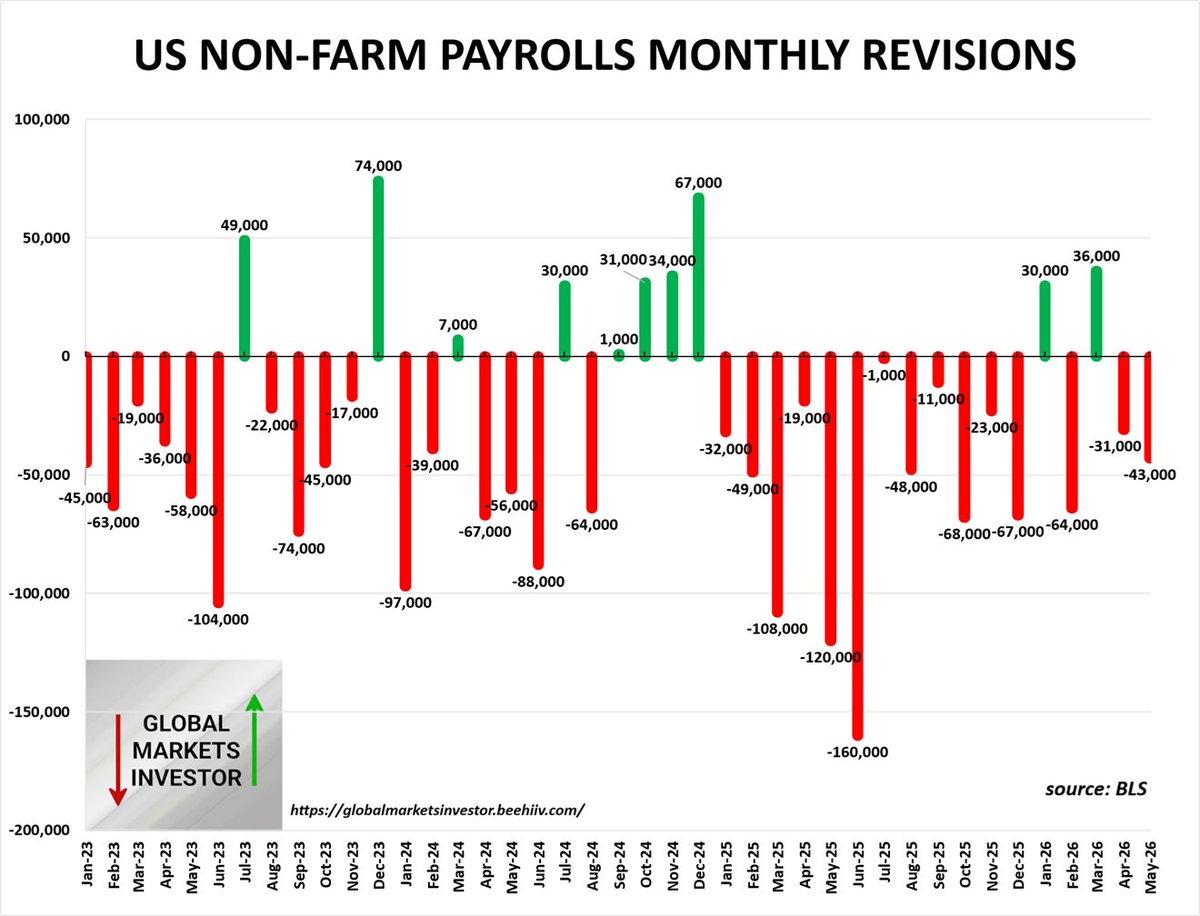
🚨US job market revisions are crazy: US non-farm payrolls for May and April were revised down by a combined -74,000, in the latest June report released on Friday. Since January 2025, non-farm employment has been revised in 15 of the last 17 months. During this period, job numbers were adjusted down by a net -778,000. Since January 2023, 31 of the last 41 months have been revised down. What is happening here?
31
86
310
42,327
⚠️The cost of leverage in the US stock market is EXPLODING: The 3-month S&P 500 financing cost has risen to ~108 basis points, a record since late 2020, excluding temporary year-end funding squeezes. TAP IMAGE TO SEE FULL INSIGHT👇 globalmarketsinvestor.beehii…
3
2
7
1,795
⚠️US semiconductor stocks are INCREDIBLY EXPENSIVE: The semiconductor index $SOX forward P/E ratio hit ~30, near the top of its 15-year range. Relative to the S&P 500, semiconductors traded as high as ~1.4 times TAP IMAGE TO SEE FULL INSIGHT👇 globalmarketsinvestor.beehii…
1
4
5
2,166