$WTI
$WTI completed an important technical objective mid-week by filling its March 2 gap, a level where buyers often begin evaluating whether selling pressure has been exhausted.
Wednesday's doji candle reflected exactly what we wanted to see: indecision after a decline, signaling that bears were beginning to lose momentum while buyers started absorbing supply.
Friday, however, failed to deliver bullish confirmation, as buyers could not close above the doji's high.
Instead, price printed a bullish kicker candle, creating another signal candle that leaves crude on bullish pivot watch rather than confirming a reversal.
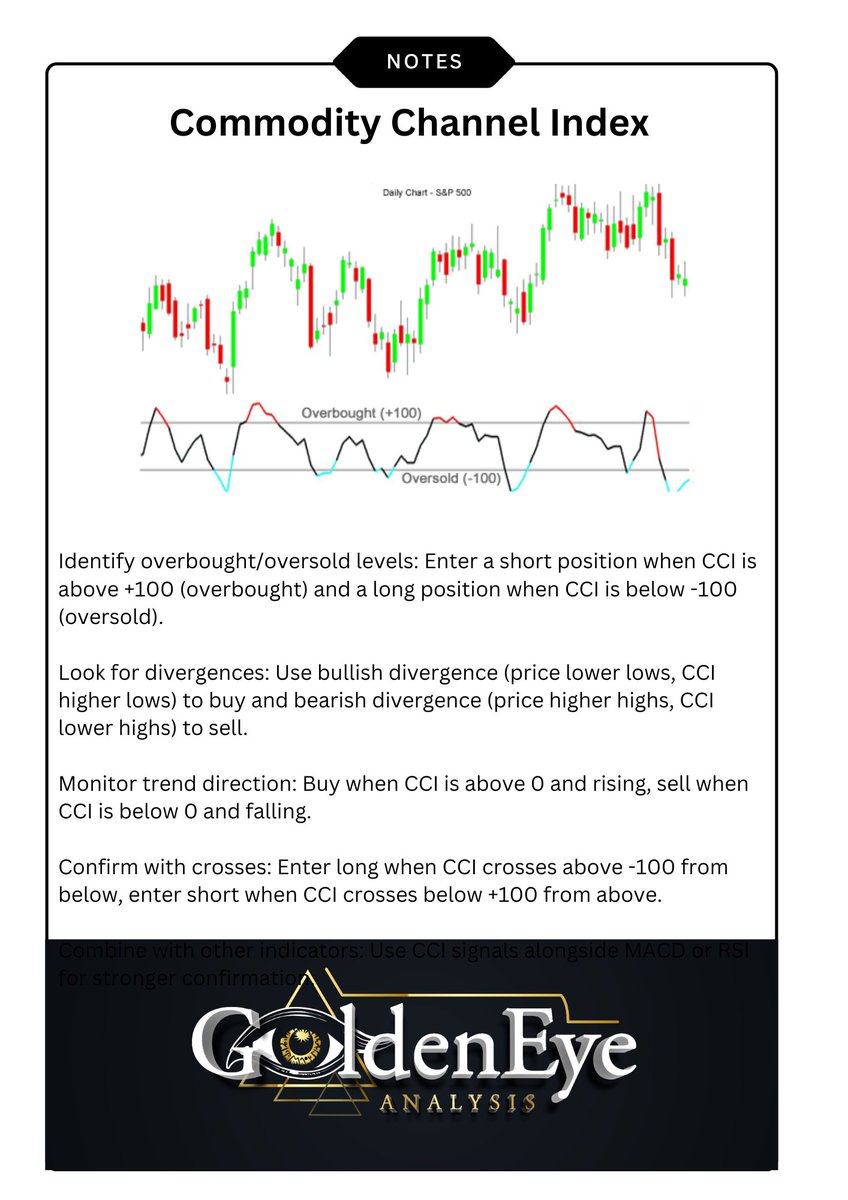
Momentum indicators are becoming more constructive and collectively suggest bearish momentum is beginning to weaken. The MACD is stabilizing, the CCI is recovering from oversold territory, and Williams %R is improving from oversold levels, all pointing to sellers gradually losing control while buying pressure begins to build.
Together, these signals suggest downside momentum is weakening, but price still owes traders confirmation. In our subscriber-exclusive
$WTI multi-timeframe technical review, we break down the daily, weekly, and monthly charts, explain exactly what these indicators are signaling, and share the specific price action and confirmation we're looking for next week before considering a high-probability bullish pivot reversal entry.
If you trade
$WTI or the energy sector, join us at
goldeneyeanalysis.com for our daily post-market technical video reviews, trade setups, real-time entry / exit signals, and why not come trade with us?
#CL #CRUDE #CRUDEOIL #ENERGY $AR $BNO $BP $BRENT $CHK $COP $CVX #WTI $DBO $DRIP $ET $FENY $IEO $OIL $OILK $OIH $OXY $PBR $PR $RIG $RRC $SCO $SLB $SWN $UCO $UGA $USL $USO $USOIL $VDE $WTI $XOM